Recently, I’ve decided to start learning Google Data Studio. And I find DS a more convenient and easy-to-use tool when compared to others. Below are a few notes that I took while following the tutorial of Adam Finer on LearnBI.online
About BI tools
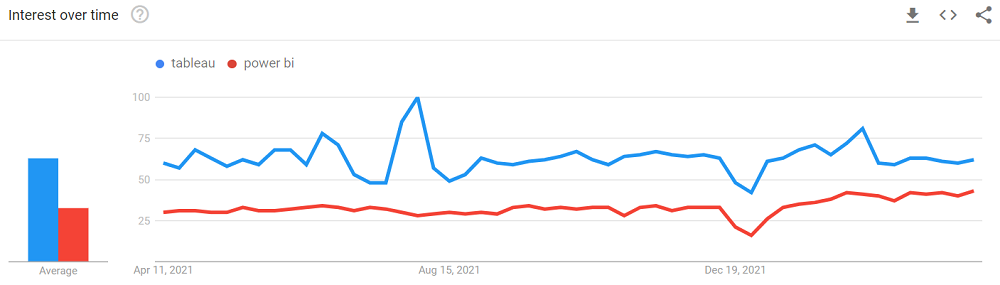
I’ve been learning Tableau for a while and I totally enjoy creating dashboards with it. In my opinion, the reason that lots of people and I find Tableau the best visualization tool is the ability to customize each visual, create stunning charts, handle large datasets, and also a large and supportive community. On the other hand, this also makes Tableau’s beginners overwhelmed by its function and requires a great deal of time to practice it.
Recently, a new candidate from Microsoft has attracted the attention is Power BI. Embedded a data transformation feature – Power Query that allowed users to connect, combine, and clean multiple sources of data; and other data modeling techniques that let users establish relationships and create data. (These tasks can also be performed by Tableau Prep).
To talk about visualization features, by minimizing the ability to customize each visual and providing lots of built-in charts, Power BI allows users to create appealing dashboards much quicker. However, when I decide to modify a visual, I’m quite confused and annoyed by the way it works. Why don’t they just let users double-click on the title to format it :/
Coming back to Google Data Studio.
What makes Data Studio special
To me, being a free-to-use reporting tool is a noticeable aspect, instead of paying $700/year for a Tableau license or $200/year for a Power BI account. Also, by supporting lots of connections to other platforms in the Google ecosystem (Analytics, Ads Manager, Big Query, Youtube Analytics…), Data Studio is also a savior for those usually depending on the Data Engineering team.
Also, by using similar syntax as Power BI and simplifying the style customizing, Data Studio allows beginners to quickly engage and create an appealing and minimal dashboard. After finishing a dashboard, users can easily share it with others like the way they work with Google Docs files.
Build a dashboard with Data Studio
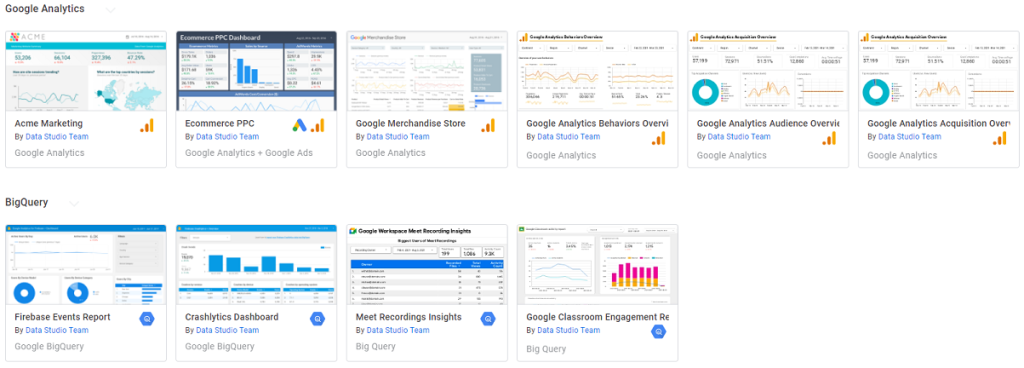
By default, Google has already provided a few comprehensive dashboards on Gallery which is a great place to start.
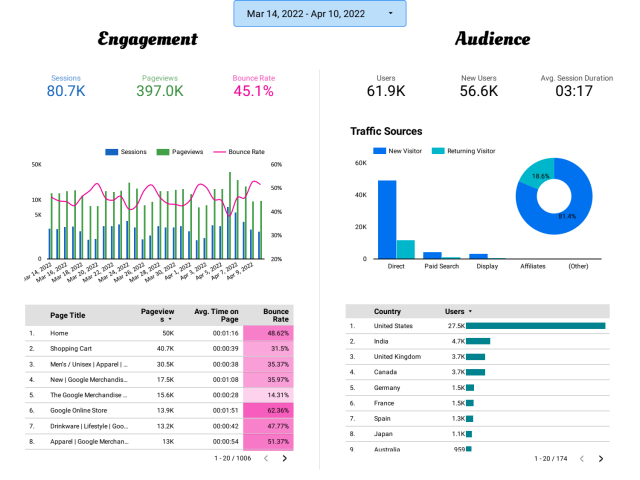
Following Adam Finer’s tutorial, I start creating my first dashboard. This dashboard utilizes the Google Analytics Data sample which tracks the performance of an online selling website.
Here are the ways Adam organizes the dashboard and tells the story:
- Summary website performance and user engagements
- Deep dive into demographics, user characteristics, and behaviors
- And a list of multiple scorecards of website performance over different time periods. (I think this idea is great to have a tracker)
So here is the Dashboard that I recreate, based on the tutorial:
Though the dashboard is stunning and comprehensive, I hope that I could add another trend analysis or an exploration page.
Yeah, that’s it. There are lots of features in DS that I wish to learn and share with you. So, stay tuned, I’ll be back soon.
Thank you for visiting the site. If you have any ideas, please let me know in the comment.
Happy reading ༼ つ ◕_◕ ༽つ