Last week I came across the website of the General Statistics Office of Vietnam (GSO) and I was totally surprised by the number of datasets published here. After reviewing these, I decided that I am going to create a few visuals to learn more about visualization and also to put these into the portfolio. So, let’s explore the first one with me.
Where to find the idea?
Scraping the Internet to look for a presentation idea, I came across the #IronQuest – A data visualization contest hosted by Sara Bartlett which encouraged people to share their visuals, and tell their own stories. And in the last August/September contest, the topic was “Travel & Vacations” where participants shared their own data and told stories about travel and vacations. (I embed the contest below.)
After watching all of 23 visuals, I came up with narration to tell the story. The story of Vietnam – the diverse country with vibrant landscapes and heroic history. It’s also a chance to remind me of the bucked list that I’ve been procrastinating to achieve for a long time.
So the narration that I intended to develop would be quite similar to these:
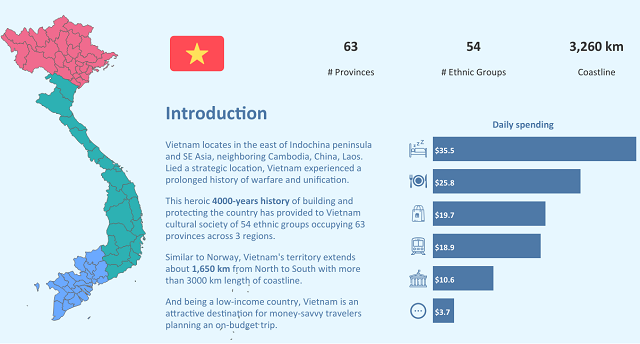
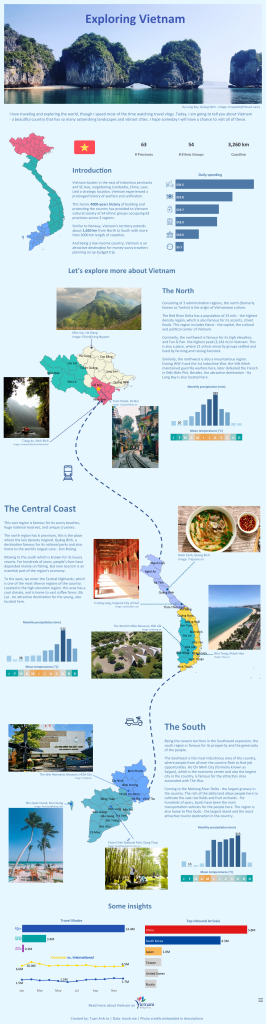
- First, the story will provide an overview of the geography, the history, and some interesting things about the country.
- Next, I present in detail the customs of people, live styles, and the climate of each region. I would probably point out several popular tourist attraction sites of these regions.
- Finally, I’m going to list some interesting insights about international tourists and their habits.
Based on these scratching ideas, I returned to the GSO’s website and started extracting data.
Extract data
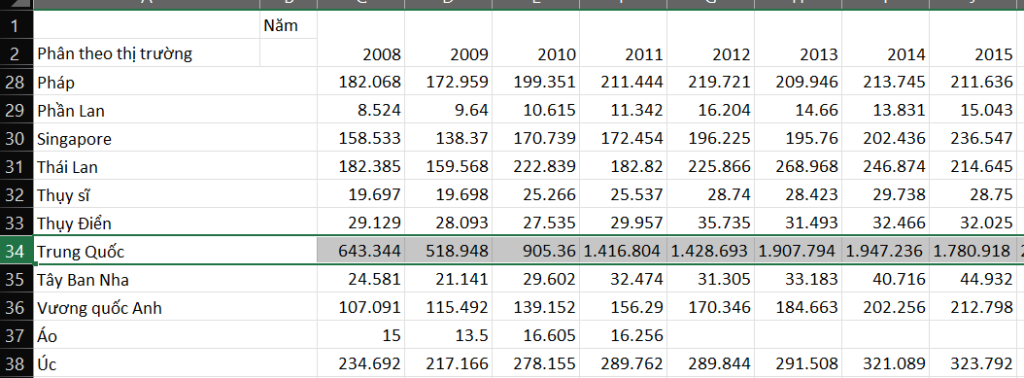
The GSO usually publishes lots of data which is about: demographics, geography, industry, and tourism… Though the provided data are quite organized, it is still needed to be cleaned through a few steps of pivoting and grouping.
Also, though tourism is affected by seasonality, GSO only organized the data by the yearly period. So I keep looking for other sources. Luckily, the Vietnam National Administration of Tourism (VNAT) also published the monthly international and domestic tourism data which are included the tourist demographics by country, and transportation modes.
But when I download this information from the website of VNAT, there is a problem with the downloaded file that is not well formated. They are not formatted as decimal numbers but as clumsy ones. So I decided to copy the whole screen directly from the website and paste them into excel worksheets. And it works well.
After cleaning these data in similar ways, I got the following datasets:
- Tourist Daily Spending
- Tourist Transportation Modes
- No. International Tourists by Month
- No. Domestics Tourist by Month
- Climate Conditions (Precipitation, Temperatures, and No. Sunshine hours)
- Vietnam’s Regions and Provinces
Visualization
Following the scratching outline, here is my Visualization which is called Exploring Vietnam. Please, check out the visual on Tableau Public to experience the Interactive version, by clicking here.
Things to learn
After creating this visual, I have a chance to discover a few visualization techniques:
- Use custom shapes as the axis label
- Add point annotations to mark attraction sites
- Another way to organize and tell a story
Also, there are some that I wish to improve in the next visuals:
- Use color wisely, precisely
- Add more actions, interactive content
- Provide more interesting insights
- Minimize the wall of text.
Besides, this visual provides me a chance to review my bucket list. And I hope someday, I will have a chance to visit all of these lovely places.
Yeah, that’s it. That’s my story.
Thank you for visiting the site.
Happy reading ༼ つ ◕_◕ ༽つ